A confident guest post today from a certain Jeff Breslin, formerly of this parish. Thanks Jeff!

One may wonder then why the Yes Scotland camp is so jubilant and the Better Together camp so agitated. One explanation for this may be simple political momentum, but a second reason why the Yes Scotland camp is so expectant of victory is that we have been here before. At the last Scottish Parliament elections the Nationalists were behind in the polls going into the final straight and pulled away to record a remarkable victory; but what actually happened back in 2011 to propel the SNP so dramatically from distant second to winners of an unheralded majority Government?
The answer is in the data tables of the polls that took place over the preceding months, with two selected here from Ipsos Mori to highlight the huge shifts in voting patterns that made the difference in the final months.
In Nov 2010, Labour enjoyed a 10% lead over the SNP in the constituency vote and a leaner 4% lead in the list vote. This comfortable position was clearly due to an 18% lead over the SNP amongst women for the constituency vote, and an 11% lead for the list vote. Amongst men, the SNP were in line with Labour for the constituency vote as far back as November 2010 and were actually ahead (by 5%) for the regional vote.
By April 2011, the political landscape in Scotland had changed, in the constituency vote women were now 41% SNP and 34% Labour (from 28% and 46% respectively), with Conservatives and Lib Dems relatively unchanged. An 18% lead for Labour had become a 7% loss. The SNP had increased its voteshare amongst women by a factor of 46% in five short months, precisely the same increase in voteshare amongst men (34% up to 50%).
What drove these late changes in the 2011 election is subjective but most would agree it was the following:
– a slick election campaign boosted by a bigger war chest than their rivals
– a more energetic door-to-door strategy from the SNP
– a poor Scottish Labour leader
– a high personal approval rating for Alex Salmond
– a positive campaign and more immediately persuasive arguments from the SNP
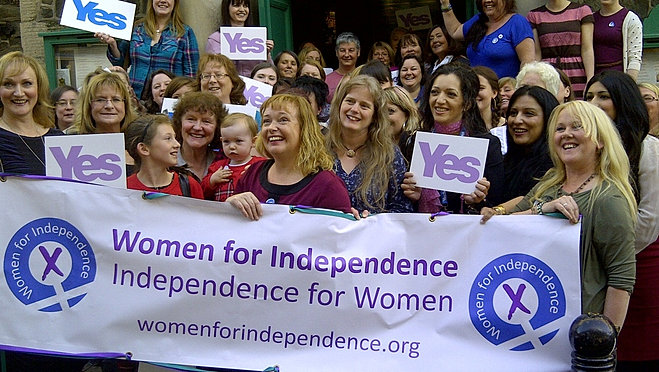
Even the most stubborn of No voters would grudgingly admit that each of the five are in position for the independence campaign, just as any Yes activist would accept that the female vote is again clearly holding the Yes side back from victory.
Recent data tables (from ICM/Scotsman March 2014) has the Yes/No vote share at 39%/46% (Female 34%/48%, Male 44%/45%). With Don’t Knows excluded, this becomes 45.5% vs 54.5% (Female 42%/58%, Male 49%/51%).
Scotland is in precisely the same position as it was in November 2010, with men splitting evenly between the two main options, women positioned to vote for the status quo, the same length of time to go to voting day and the five campaign factors as noted above securely in place.
Referendums are not the same as elections, and there is no independence incumbency factor, but if history repeats itself in September 2014, and all moving parts are in place to assume that it will, the Yes camp is on course for a landslide.
 One of the most interesting swing constituencies for the independence referendum is just one person –
